The True Cost of Bad Onboarding Is Not (Just) Churn
Six costs of bad onboarding, where each one shows up in your numbers, and the method for calculating what it is costing you annually.


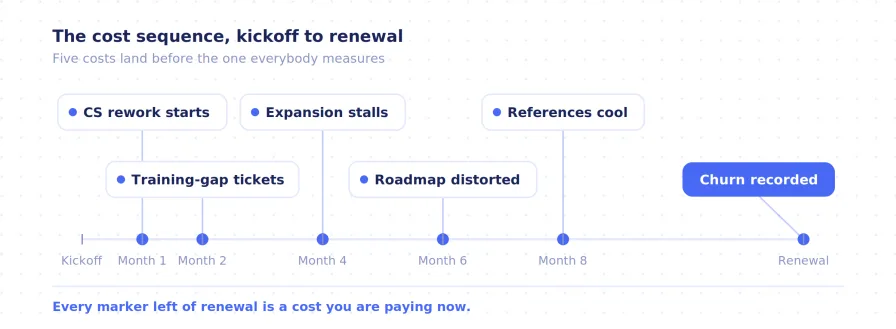
Churn is the cost everyone counts, and it is the last one to arrive. By the time a logo lands on the churn report, you have already paid for that failed implementation four or five times over, in line items nobody attributed to onboarding.
So here is the argument: bad onboarding is not a retention problem you discover at renewal. It is a compounding operating cost you are paying this quarter, right now, in your CS team's calendar, your expansion pipeline, your support queue, and your sales cycle length. Churn is just the receipt at the end.
Below are the six costs I have watched teams absorb without ever naming them, and the number to pull for each one.
What does bad customer onboarding actually cost?
Bad customer onboarding costs more than the lost ARR of the accounts that churn. The full cost is the sum of six things: customer success hours spent redoing work, expansion revenue that never enters pipeline, support tickets caused by training gaps, longer sales cycles from a weak reference base, product roadmap decisions made on distorted signal, and the operating cost of having no early warning system for account risk.
Only the first of those shows up on a churn report. The other five are absorbed quietly by teams who do not code them back to onboarding.
How much CS capacity does bad onboarding consume?
When I ran customer success teams previously, the most expensive thing on my P&L was not headcount. It was headcount doing the same work twice.
The pattern looked like this. An implementation "finishes" on paper. The customer goes live with half their locations configured, one champion trained, and a data migration everyone agreed to circle back on. Six months later that account is still consuming CSM hours, except now the hours are unbudgeted, reactive, and invisible. Nobody logs them as onboarding. They get logged as support, or as relationship management, or as nothing at all.
Pull this number: the percentage of your CS team's hours going to accounts that are past their go-live date but still doing go-live work. If your systems cannot produce that number, that is itself the finding.
How does bad onboarding affect expansion revenue?
Every expansion motion rests on one assumption: that the first deployment worked. A customer who never reached first value does not buy the second product, does not add the second location, and does not champion you internally for the enterprise agreement.
This cost is nearly impossible to see because it shows up as an absence. There is no meeting where someone says "we lost that upsell because onboarding was sloppy in month two." The opportunity simply never enters the pipeline.
Pull this number: net revenue retention segmented by onboarding milestone completion. Compare accounts that hit every milestone against accounts that stalled. The gap between those two cohorts is your onboarding gap, priced in ARR.
<!-- JASON: this is the single highest-value place to insert a real number from your data. One proprietary stat here is what gets this post quoted by AI answer engines and linked by other writers. Format it as a standalone sentence so it is easy to extract, e.g. "In our own customer base, accounts that completed every onboarding milestone expanded at X% while stalled accounts expanded at Y%." -->
Are your support tickets actually an onboarding problem?
Often, yes. A meaningful share of what your support team classifies as product issues are not product issues. They are "nobody ever showed this person how." The ticket gets tagged as a bug or a usability complaint, the cost lands on the support budget, and the root cause stays hidden inside an onboarding process that ended too early.
This is sharpest in vertical SaaS. When your end users are dental office managers, restaurant GMs, or salon owners, they are not going to file a clean bug report and they are not going to read the docs. They are going to call, and they are going to call the same person every time.
Pull this number: ticket volume per account in the first 180 days, split by whether the account completed training milestones.
How does onboarding affect sales cycle length?
Through your reference base. Vertical markets are small and they talk. Every operator in a niche knows the other operators in that niche, and they compare notes at conferences, in association meetings, and in private group chats. A customer who had a rough implementation does not usually leave a bad review. They just answer honestly when a peer asks.
The cost lands on sales as longer cycles, more implementation scrutiny in late-stage deals, and reference calls you cannot confidently offer. Nobody traces it back to a rollout that went sideways two years ago.
Pull this number: the ratio of live customers to customers you would actually put on a reference call. In most companies I have seen, that ratio is worse than leadership assumes.
Can bad onboarding distort your product roadmap?
Yes, and this one is expensive in a way that is hard to reverse. Product teams build for the customers who complain loudest. If a large share of complaints come from customers who were never configured correctly in the first place, you are prioritizing engineering work against a distorted signal. You end up shipping features to compensate for an implementation gap, which is one of the most expensive ways to solve a process problem.
Why is churn rate the wrong metric to manage onboarding by?
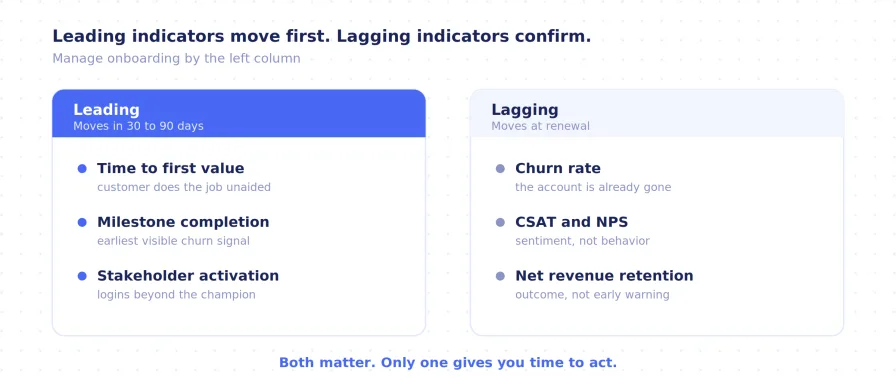
Because churn rate is a lagging indicator. It tells you about a battle you already lost, with precision, confidence, and zero usefulness. By the time the number moves, the account is gone and the renewal conversation is over.
The deeper issue is visibility. If onboarding is running on a project management tool, a spreadsheet, and a Slack channel, you do not have a system of record. You have five systems of opinion. Leadership gets no early read on account health, and the first hard signal arrives at renewal, which is the one moment when it is too late to act.
Which onboarding metrics are leading indicators?
Three metrics predict renewal, expansion, and churn risk early enough to change the outcome:
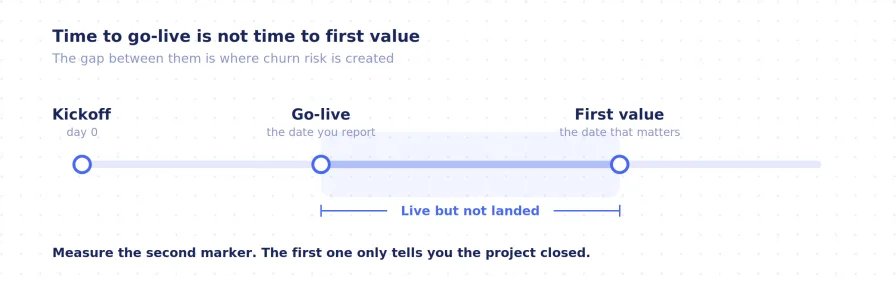
Time to first value. Not time to go-live. Time until the customer does the thing they bought you to do, in production, on their own.
Milestone completion rate. By account and by cohort. Stalled milestones are the earliest visible churn signal you will get.
Stakeholder activation. How many people at the account have logged in and done real work, versus one champion carrying the whole deployment. Single-champion accounts are fragile accounts, and in multi-location rollouts they are the default unless you design against it.
Each of these is measurable in the first 30 to 90 days. Each of them moves before revenue does.
How do you calculate your own cost of bad onboarding?
Do not borrow a benchmark from a vendor blog. Run this against your own data:
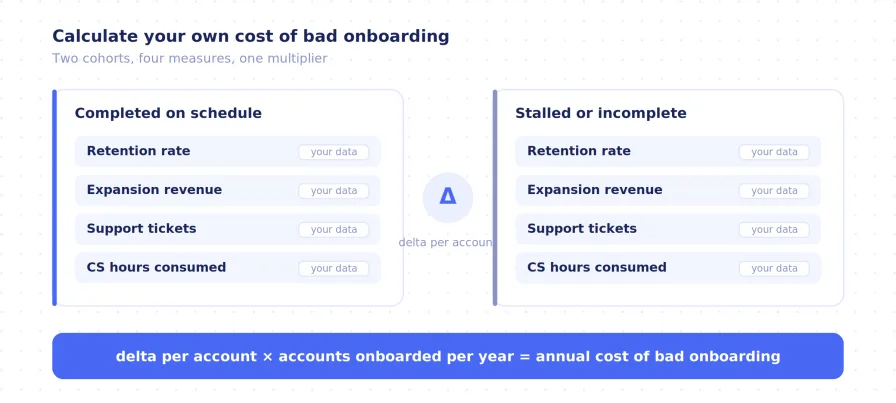
Take every account from the last four full quarters.
Split them into two cohorts: accounts that completed onboarding on schedule, and accounts that did not.
Compare retention rate, expansion revenue, support ticket volume, and CS hours consumed across the two cohorts.
Multiply the per-account delta by the number of accounts you onboard in a year.
Whatever falls out of step four is your annual cost of bad onboarding. In my experience it is larger than the cost of fixing the process, usually by a wide margin, and it is the only version of this analysis a CFO will trust.
Why is onboarding an aspirin, not a vitamin?
Because it treats an acute, expensive problem rather than promoting general wellness. Onboarding gets underfunded when it is filed under customer experience, next to NPS surveys and welcome gifts. That framing is wrong. Onboarding is the one process that determines whether revenue you already booked converts into revenue you keep, and whether an account ever becomes worth more than it was on day one.
Treat it like the risk mitigation it is. Instrument it like a funnel. Report it to the board next to pipeline, not next to CSAT.
Frequently asked questions
What is considered bad customer onboarding? Onboarding is failing when the customer reaches "go-live" without reaching first value: the configuration is incomplete, only one stakeholder is trained, and the CS team is still doing implementation work months after the project was marked complete.
How long should B2B SaaS onboarding take? It depends on implementation complexity, but the more useful question is time to first value rather than time to go-live. The target is the shortest period in which the customer can independently perform the core job they purchased the software to do.
Is bad onboarding the main cause of churn? It is one of the largest causes, but framing it as a churn problem understates it. Bad onboarding suppresses expansion revenue, inflates support and CS cost, and weakens the reference base long before any account actually churns.
What onboarding metrics should we report to leadership? Time to first value, milestone completion rate, and stakeholder activation, segmented by cohort. These are leading indicators. Churn rate and CSAT are lagging indicators and should not be the primary management signal for onboarding.
Should we build our onboarding process in a project management tool? You can, and most teams start there. The tradeoff is that a project management tool plus a spreadsheet plus a Slack channel gives you task tracking without customer-facing visibility, cohort reporting, or leading indicators. The licensing is cheap; the CS time and blind spots are not.
If you want to run this analysis against your own onboarding data, book a call with our team and we will walk through it with you.
More Posts

How to Tell if Bad Onboarding Is Causing Your Churn

Onboard.io Now Supports MCP: Connect Your Onboarding Data to AI Agents


